
In many ways, running a successful organization is like treating a patient. When a patient shows signs of illness—such as a fever or persistent aches—merely addressing the symptoms provides temporary relief at best. A skilled physician digs deeper to discover what is causing the symptoms, ensuring targeted treatment that resolves the illness rather than merely masking it. Root Cause Analysis (RCA) operates on precisely the same principle but within the realm of business, safety, and quality management. Instead of treating organizational “symptoms” (like rising defect rates, sudden equipment failures, or near-miss safety incidents) on the surface level, effective RCA goes straight to the heart of why these issues are happening in the first place.
Root cause analysis is not a single, monolithic approach. There are several recognized methodologies—some of which are relatively straightforward, while others can be more robust and specialized. In this article, we will delve into several of the most commonly used tools and techniques, from the classic “5 Whys” and the ever-popular “Fishbone Diagram” to more sophisticated frameworks such as Bowtie Analysis and TapRooT. By the end of this exploration, you should have a clearer understanding of how to tailor each method to your organizational needs, and how to use these tools to generate real, lasting improvements rather than quick fixes.
1. The Purpose and Power of Root Cause Analysis
At its core, root cause analysis revolves around the idea that a problem is rarely solved by treating only its superficial manifestations. For instance, if a machine on a production line keeps shutting down unexpectedly, one could simply restart it and note the downtime. But until you figure out why it is shutting down, you will likely face the same malfunction repeatedly, with all the accompanying costs and disruptions. The same logic applies to occupational health and safety (OHS) incidents. A slip-and-fall accident could be handled by sending the employee for first aid and cleaning up the spill. But without identifying why the spill occurred—and why the employee was unaware of it or could not avoid it—you leave the underlying hazard intact.
Root cause analysis is also about continuous improvement. Whether a problem surfaces in product quality, workplace safety, chemical processing, or any other domain, uncovering and correcting the root cause shifts an organization from a reactive mindset to a proactive one. Instead of fighting fires (sometimes literally, in the case of safety incidents), you eliminate the conditions that allow those fires to spark in the first place.
2. “5 Whys”: Stripping Away the Layers
One of the simplest and most widely cited RCA techniques is the “5 Whys.” Conceptually, it is straightforward: you start with a problem statement and ask, “Why did this happen?” Then, for each answer, you ask “Why?” again. You repeat this process until you reach what you believe to be the fundamental cause of the problem—something that, if corrected, would prevent the issue from recurring.
For example, suppose a distribution facility’s conveyor belt suddenly stops working. You might walk through the “5 Whys” analysis as follows:
- Why did the conveyor belt stop? Because the motor that drives the belt overheated and shut down.
- Why did the motor overheat? Because dust and debris had accumulated in the motor’s cooling vents, blocking airflow.
- Why was there so much dust in the cooling vents? Because routine cleaning procedures were not carried out last month.
- Why were routine cleaning procedures skipped? Because the maintenance team was short-staffed, and priorities shifted to emergency repairs instead.
- Why was the maintenance team short-staffed? Because budget cuts reduced the workforce, and there was no contingency plan for routine tasks.
By the time you reach that fifth layer (or sometimes sooner), you start uncovering organizational or systemic issues. It might be tempting to stop after determining that dust caused the motor to fail, but that explanation alone doesn’t prevent the next incident. You need to address the staffing and resource allocation problem to ensure that routine preventive maintenance does not get skipped.
The beauty of the “5 Whys” method is its simplicity. It requires no specialized software, no complicated diagrams, and minimal training. However, this simplicity can also be a weakness if the team stops asking “Why?” prematurely. Sometimes the root cause might be at a deeper, more systemic level, such as a flawed policy or an unspoken organizational culture that discourages reporting or maintenance scheduling. Another limitation is that “5 Whys” might lead different analysts to different conclusions if they do not follow a structured approach, especially in a group setting. Still, for everyday problem-solving—especially in less complex situations—this technique can be invaluable.
3. The Fishbone Diagram (Ishikawa Diagram): A Structured Visual Approach
If “5 Whys” can be likened to peeling an onion, the Fishbone Diagram (also called the Ishikawa Diagram or cause-and-effect diagram) is more like mapping out an entire orchard. This visual tool was popularized by Kaoru Ishikawa, a Japanese organizational theorist, as a way to break down complex problems into categories of possible causes.
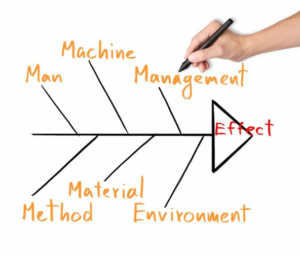
A Fishbone Diagram typically starts with the problem statement (the “effect”) at the head of the fish. The backbone extends horizontally, and several spines (or “ribs”) branch off, each spine representing a category of causes. Many organizations use the “6 Ms” for manufacturing problems—Manpower (People), Machinery, Methods, Materials, Measurement, and Mother Nature (Environment). In a service or office environment, similar categories might be adapted, such as People, Processes, Policies, Equipment, and so on.
For example, imagine a scenario where a bakery’s bread loaves are coming out with inconsistent sizes. The production supervisor gathers a small team to create a Fishbone Diagram. They draw a horizontal line ending in the problem statement: “Inconsistent loaf sizes.” Then they label four main spines: People, Machinery, Methods, and Materials. Along each spine, they brainstorm possible contributing factors. Under “People,” they note that new staff might be measuring dough incorrectly. Under “Machinery,” they consider that the oven temperature gauge may be faulty. Under “Methods,” they examine whether the dough-proofing procedure is consistently followed. Under “Materials,” they check whether flour quality has changed, or yeast storage is suboptimal. By visually parsing these elements, they can see which areas need deeper investigation.
One strength of the Fishbone Diagram is that it encourages a team to consider multiple categories of root causes, rather than jumping to a single explanation. It is also relatively easy for any participant to grasp, which fosters participation and collaborative brainstorming. A potential shortcoming is that it can be unwieldy for extremely complicated incidents. In such cases, it might serve as a starting point, before a more advanced approach is taken to truly drill down into the highest-priority suspect causes.
4. Going Deeper with Bowtie Analysis
In high-hazard industries like chemical processing, aviation, and oil and gas, organizations often need more than just a simple brainstorming session. Bowtie Analysis is a technique that has gained traction in these sectors because it offers a structured way to visualize threats, barriers, and potential outcomes. It is frequently used for major accident hazard scenarios, though it can be adapted for broader organizational issues.
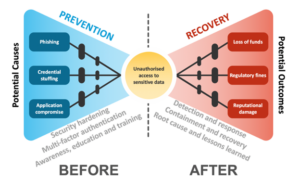
A Bowtie Diagram looks exactly like its name suggests: a knot in the middle represents the critical event (or hazard), and two symmetrical sides bow out from the center. On the left side, you list the threats that could lead to the hazard. On the right side, you list the consequences should the hazard materialize. Between the threats and the central hazard, you illustrate the proactive or preventative barriers designed to stop the event from happening. Between the hazard and the consequences, you illustrate the reactive or mitigative barriers that aim to minimize the impact if the hazard does occur.
Take, for example, a chemical manufacturing plant that handles large quantities of flammable liquids. The central hazard might be “massive chemical fire.” On the left side of the bowtie, threats could include poor storage of flammable containers, static discharge during liquid transfer, or faulty containment systems. The preventative barriers could be properly grounded equipment, strict storage guidelines, and regular inspections for leaks. On the right side, consequences might range from property damage to employee injuries, environmental contamination, or even fatalities. Mitigative barriers could be automatic fire-suppression systems, well-practiced emergency response plans, and containment walls to limit the spread.
One of the key values of Bowtie Analysis is that it forces you to visualize not only the cause-and-effect chain but also the controls you have in place or plan to implement. This format can highlight gaps, such as a missing barrier or an under-tested contingency. It is particularly useful for giving stakeholders a big-picture view, making it more than just a theoretical RCA method and turning it into a practical risk assessment and management tool. However, Bowtie Analysis can be time-consuming and may require facilitation by individuals trained in the method, especially for complex hazards.
5. TapRooT®: A Comprehensive RCA System
TapRooT is another advanced method for root cause analysis, often favored by high-risk sectors like aviation, nuclear power, petrochemicals, and healthcare. It is not just a tool but a comprehensive system, which includes diagrams, software, and procedural guidelines to help investigators identify root causes systematically.
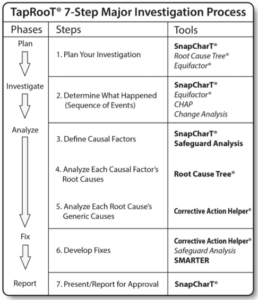
Unlike the more open-ended brainstorming of Fishbone or the iterative questioning of “5 Whys,” TapRooT is driven by a standardized process. Investigators collect information about the incident, map out a “SnapCharT” (a timeline of events and conditions), then use TapRooT’s built-in Root Cause Tree and associated dictionaries to pinpoint causal factors. The Root Cause Tree is structured around common categories such as Human Performance, Procedures, Training, Management Systems, or Equipment Issues. Each branch has more detailed subdivisions, helping the investigator drill down to very specific root causes.
The advantage of TapRooT is that it reduces some of the subjectivity inherent in other methods, guiding investigators to examine specific failures in human factors or management systems. It also emphasizes lessons learned and corrective actions. For instance, a TapRooT analysis of a serious forklift accident might find a primary root cause in “Inadequate Supervision,” plus a secondary cause in “Equipment Not Maintained,” each of which is mapped onto a branch of the Root Cause Tree. The final step involves generating corrective actions that address these specific failures, such as training supervisors to enforce rules more diligently and scheduling more frequent forklift inspections.
One potential drawback is that TapRooT can feel too rigid or complex for smaller organizations that lack the time or expertise to dive deeply into a prescriptive system. It can also require specialized training and licensing for the software components. However, for companies where safety, compliance, or quality issues have critical, high-impact implications, TapRooT’s thoroughness and consistency can be a worthwhile investment.
6. Choosing the Right Method for the Job
With so many options at hand, how do you decide which root cause analysis method to use?
A good rule of thumb is to weigh complexity against potential impact. If you are dealing with a simple or everyday type of issue—perhaps a minor equipment glitch that occurs occasionally— “5 Whys” might be sufficient. You can run through the process quickly, identify the main cause, and implement a fix. On the other hand, if you work in an environment where mistakes can mean major financial losses or risks to human life (like aviation, oil refining, or large-scale chemical processing), a more robust methodology such as Bowtie Analysis or TapRooT is likely justified.
The scale and scope of the problem also matter. The Fishbone Diagram is great for medium-complexity issues where brainstorming multiple categories is advantageous. Bowtie Analysis excels at visualizing major hazard scenarios with multiple threats and serious consequences. TapRooT offers a standardized, procedure-driven approach that can handle everything from near misses to catastrophic events, but it might require resources that not all organizations have readily available.
Some organizations use a combination of methods. For instance, they might start an investigation using a Fishbone Diagram to brainstorm potential causes, then apply “5 Whys” to the most promising leads. Or they might build a Bowtie Diagram for a major hazard scenario, identifying the barriers in place, and then use a TapRooT investigation if those barriers fail. The important point is to choose a systematic process and apply it consistently. An RCA that is half-finished or riddled with arbitrary assumptions can end up being worse than no analysis at all—because it may give a false sense of security.
7. Ensuring Effective Implementation of Corrective Actions
Regardless of which root cause analysis technique you use, the ultimate measure of success is whether it leads to meaningful, lasting improvements. Too often, teams pour time and energy into elaborate investigations, only to let the final reports collect dust on a shelf or get lost in an email archive. Implementation is key. Once root causes are identified, corrective actions should be clearly defined, assigned to specific individuals or departments, and accompanied by reasonable deadlines and metrics for success.
For instance, if a “5 Whys” analysis reveals that a training gap is leading to repeated errors on a production line, you might decide to develop a new training module. But who will design the module, and by when? How will you measure whether the new training reduces errors? By setting concrete goals—like a 50% reduction in production errors over the next quarter—you give the team a clear, data-driven target to strive for. Later, you can revisit the data to see if your solution is working or needs revision.
Many organizations integrate root cause analysis findings into continuous improvement programs (like Lean Six Sigma or ISO management systems) to maintain accountability. They might schedule a follow-up audit or a “lessons learned” meeting after a few months. In some high-risk industries, regulators even require proof of corrective actions for major incidents, or they may conduct spot inspections to verify that changes have been implemented. By tying the RCA process to a broader management framework, you ensure that the effort doesn’t stop once the root cause is identified.
8. Bridging RCA with Broader Organizational Culture
Root cause analysis cannot thrive in a vacuum. It is most effective when embedded in a corporate culture that values transparency, learning, and proactive problem-solving. For instance, if employees are afraid to speak up when they see a hazard or make a mistake, your best analysis tools won’t capture accurate data. A blame-free environment—where the focus is on identifying and rectifying systemic issues rather than punishing individuals—fosters candor and collaboration.
Many of the methods discussed here, especially the “5 Whys” and Fishbone Diagram, benefit from group participation. If your workplace has a Joint Health and Safety Committee or a dedicated quality improvement team, involving them in the RCA fosters shared ownership of the solution. Bowtie Analysis and TapRooT can also be run as collaborative exercises, although they may require a facilitator who is trained in the methodology. Encouraging cross-functional involvement is valuable because safety incidents, quality defects, or operational inefficiencies often straddle multiple departments or areas of expertise.
In a positive, learning-focused culture, teams welcome root cause analyses as opportunities to grow and improve. Over time, you might notice fewer repeated problems, and your workforce may develop a sharper eye for identifying and addressing potential issues before they escalate. Metrics like incident frequency rates, defect counts, and near-miss reports can serve as leading indicators of how well your culture embraces RCA. If near-miss reporting increases—because people feel safe sharing close calls—and serious incidents decrease, you know you’re on the right track.
9. Case Examples to Illustrate Different Methodologies
It can be illuminating to see how different RCA methods might tackle the same basic scenario. Imagine a mid-sized manufacturing plant that produces metal components for the automotive industry. The plant has recently experienced a series of near misses involving hand injuries on a stamping press. Each near miss involved workers who were not wearing proper protective gloves when adjusting materials in the press. Thankfully, no one was seriously hurt, but management wants to avoid a real injury.
If the plant uses the “5 Whys” approach, they might keep asking “Why did the worker not wear proper PPE?” until they uncover that the supply room often runs out of gloves by midday, because the purchasing policy relies on monthly estimates rather than real-time inventory checks. They might also discover that the gloves provided are uncomfortable, leading workers to remove them when performing detailed adjustments.
If they use a Fishbone Diagram, they will likely have a section for Materials (quality of gloves), People (worker training, supervision, and comfort), Methods (PPE distribution processes), Machinery (design of the stamping press, ease of adjustment), and Environment (lighting, signage). This structured approach can highlight not only the supply chain issue but also potential machinery design or training gaps.
For a high-risk environment or a major accident scenario—say, a serious hydraulic press failure that injured multiple workers—the plant might conduct a Bowtie Analysis. The threat side of the diagram could include improper maintenance, operator errors, or flawed hydraulic system design. The central hazard is a catastrophic press failure, and the potential consequences might be severe injuries, amputations, and production shutdowns. They would then map out the existing barriers (like regular safety inspections, lockout/tagout procedures, and emergency stop mechanisms) and see which ones failed. On the right side, they would look at mitigation measures (like first-aid readiness, well-trained emergency responders, or secondary containment for hydraulic fluid leaks) to limit harm if a press failure does occur.
And finally, for an even more rigorous investigation—especially if the accident triggered regulatory scrutiny—TapRooT could be applied. Investigators would collect witness statements, gather maintenance logs, map out the events in a SnapCharT, and systematically move down the Root Cause Tree. The goal might be to confirm whether the root cause involves insufficient management oversight, inadequate training, flawed design, or some confluence of all three.
In each case, the same core problem—workers at risk around a stamping press—receives different degrees of examination based on the method chosen and the complexity of the situation.
10. Looking Ahead: Sustaining a Root Cause Mindset
Root cause analysis is not a one-time event reserved only for crises. Many organizations integrate some form of RCA into their daily or weekly routines. For smaller or more routine issues, a quick “5 Whys” session can be enough to keep processes on track. For recurring or potentially catastrophic issues, a more thorough approach might be warranted. By making RCA a standard part of project debriefs, safety committee meetings, or quality improvement initiatives, you create a continuous feedback loop. Over time, employees become adept at identifying not just what went wrong, but why it went wrong, and how it can be prevented.
In Canada, many workplaces use root cause analysis as part of compliance with provincial or territorial occupational health and safety laws, or within frameworks like ISO 45001 for OHS Management Systems, ISO 9001 for Quality Management Systems, or CSA Z1000 for safety management. In these standards, a documented process for identifying and correcting root causes is often central to achieving certifications and demonstrating ongoing improvement. Similarly, in sectors with tight regulatory oversight—like aviation (governed by Transport Canada) or pipeline operations (governed by the Canada Energy Regulator)—root cause analysis is not just a best practice but often an explicit requirement following major incidents.
Looking ahead, methods will likely evolve, with more emphasis on real-time data collection and automated analytics tools. Some organizations already employ machine learning to spot anomalies that signal emerging issues. Others integrate advanced sensors to collect operational data that can feed into predictive maintenance algorithms. Despite these technological advances, the human element—good communication, teamwork, and a willingness to ask “Why?”—remains at the heart of effective root cause analysis. After all, a piece of software can highlight anomalies or potential correlations, but it takes human judgment and organizational commitment to translate that information into meaningful root cause findings and corrective actions.
11. Conclusion
Root cause analysis is both an art and a science, with methodologies that range from the minimalist elegance of “5 Whys” to the structured complexity of TapRooT®. Whichever toolset an organization chooses, the underlying goal remains the same: pinpoint the deep-seated issues that allow problems to arise and remove them at their source. This mindset is one of prevention rather than reaction, helping businesses, manufacturers, and high-risk industries alike save time, money, and—most importantly—lives.
In many scenarios, the simplest tools are more than adequate. When a small manufacturing team needs to diagnose why a certain machine keeps jamming, a quick “5 Whys” session or a basic Fishbone Diagram might solve the problem in a matter of hours. But in complex or high-hazard contexts, such as chemical plants, aviation operations, or nuclear power facilities, a more nuanced approach often proves necessary. Bowtie Analysis and TapRooT both offer rigorous frameworks for managing multiple threats and barriers, guiding investigators in a systematic exploration of how complex systems can fail.
No matter the scale, a successful root cause analysis rests on a supportive organizational culture. When workers feel safe reporting near misses, when teams commit to open collaboration, and when leadership invests in corrective actions, the stage is set for true improvement. From a slip-and-fall in a warehouse to a massive process failure in a refinery, RCA provides the lens through which these incidents transform from unfortunate events into catalysts for progress. By embracing the right methods, by asking the right questions, and by following through on corrective measures, organizations can continually reduce risk, enhance performance, and ultimately foster a safer and more efficient workplace for everyone.